Heart Rate Visualization
Fall 2024 | Interaction Design Studio: Healthcare Wearables
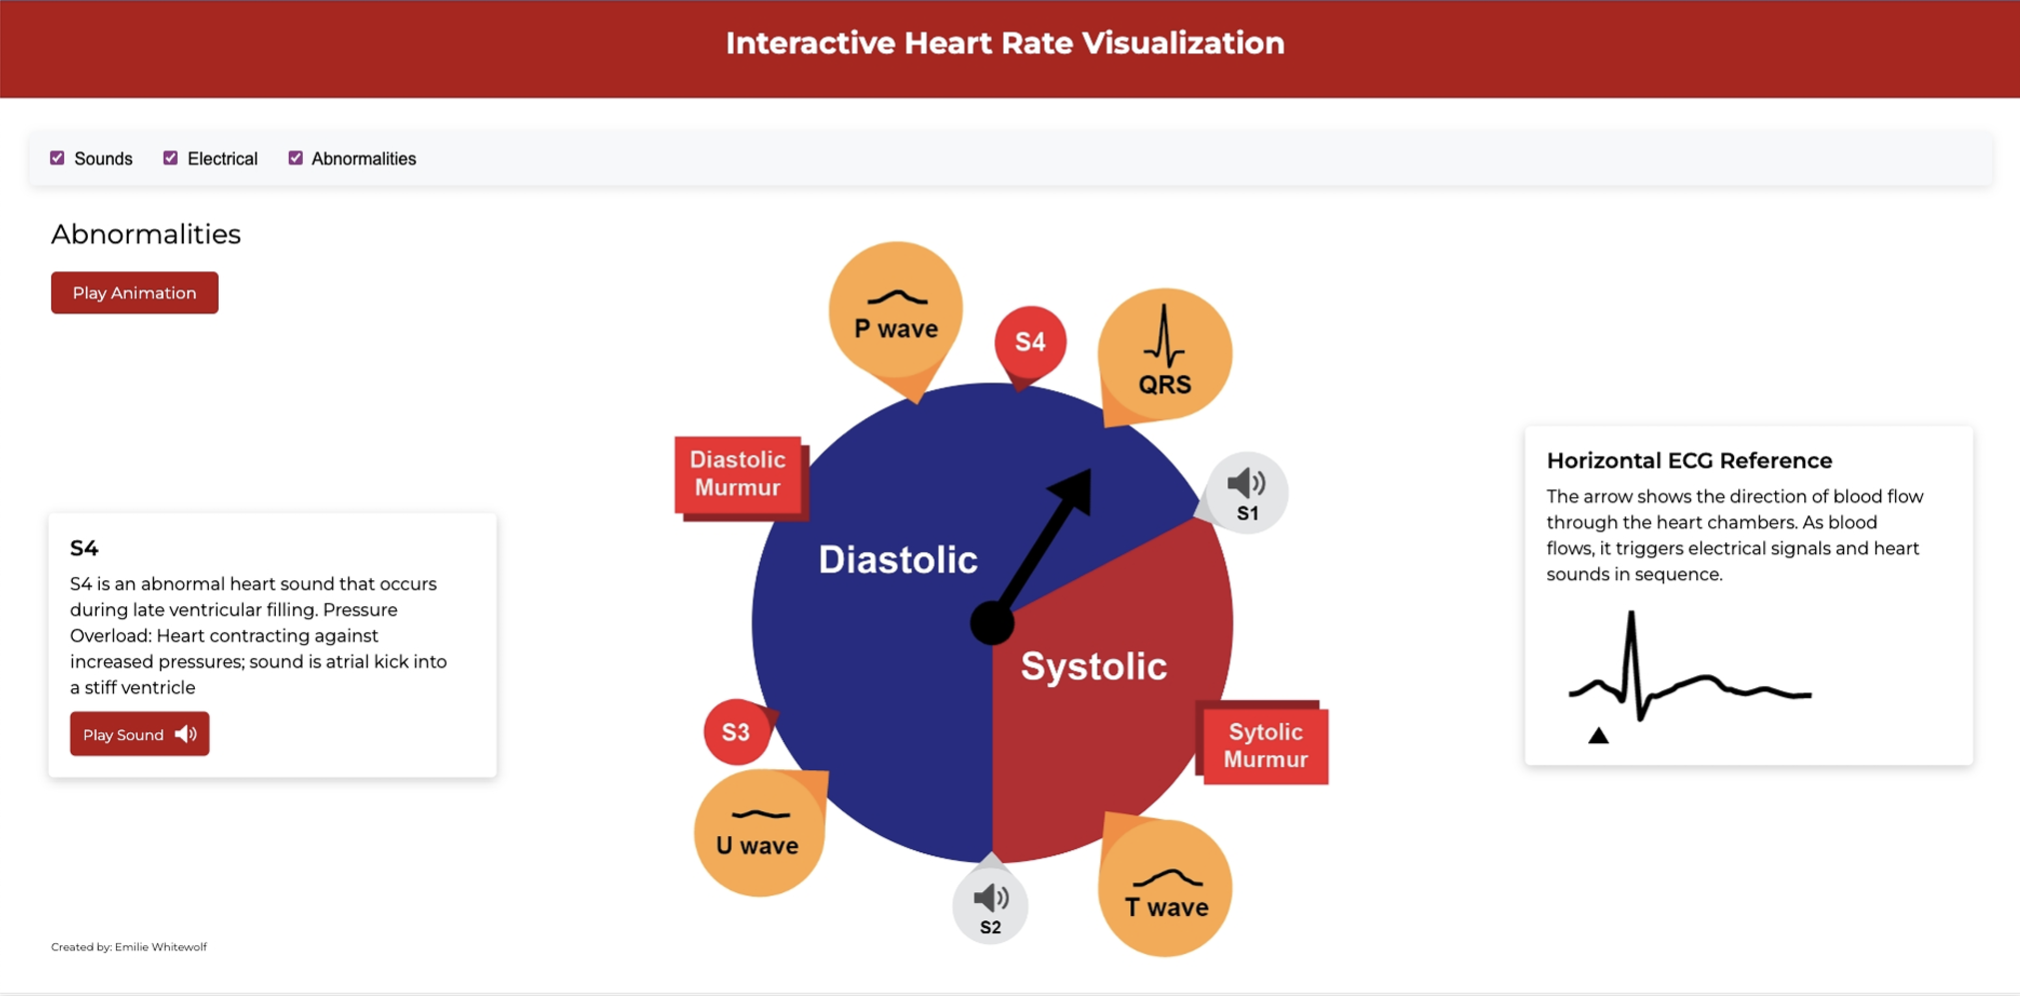
I created this interactive heart rate visualization based on a model pioneered by Dr. Michael Fink and Dr. Matthew Walko at Lebanon Valley College. The use case is an informational tool for teaching students about the heart rate cycle.
The tool contains three layers including sounds, electrical pulses, and abnormalities. Each layer can be toggled by the user. Users can click each individual sound, pulse, or abnormality to learn more about them. The tool also includes a mostly-accurate animation that shows the cycle alongside the stereotypical sound visualization of a heart beat.
The tool contains three layers including sounds, electrical pulses, and abnormalities. Each layer can be toggled by the user. Users can click each individual sound, pulse, or abnormality to learn more about them. The tool also includes a mostly-accurate animation that shows the cycle alongside the stereotypical sound visualization of a heart beat.
Skills Utilized
- HTML/CSS
- Javascript
- Cursor.ai
- Adobe Illustrator
- Adobe XD
- Data Visualization